
2009-10 by Mel_Fox_76 (VER2.6 released! on Jan 10th 2013)
Re: 2009-10 by Mel_Fox_76 (VER2.4 released! on Feb. 21st)
![]() by Andrew on Fri Mar 11, 2011 1:06 pm
by Andrew on Fri Mar 11, 2011 1:06 pm
Nicely done. 
Contact: Email | X | Bluesky
Modding Topics: NBA 2K10 | NBA Live 08 | NBA Live 07 | NBA Live 06 | NBA 2K6 | NBA Live 2005 | NBA Live 2004 | NBA Live 96
Story Topics: NBA Live 16 | NBA 2K14 | NBA 2K13 | NBA Live 06 (Part 2) | NBA Live 06 (HOF) | NBA Live 2004 (HOF)
NLSC: Podcast | The Friday Five | Monday Tip-Off | Wayback Wednesday | Facebook | X | YouTube | Instagram | Bluesky
Donations/Support: Patreon | PayPal
-
Andrew - Retro Basketball Gamer

- Posts: 115296
- Joined: Thu Aug 22, 2002 8:51 pm
- Location: Australia
Re: 2009-10 by Mel_Fox_76 (VER2.4 released! on Feb. 21st)
![]() by mariuzzs on Sat Mar 12, 2011 12:31 am
by mariuzzs on Sat Mar 12, 2011 12:31 am
upload all courts
-

mariuzzs - Posts: 149
- Joined: Wed Jul 28, 2010 10:20 pm
- Location: Lithuania
Re: 2009-10 by Mel_Fox_76 (VER2.4 released! on Feb. 21st)
![]() by Mel_Fox_76 on Sat Mar 12, 2011 3:16 am
by Mel_Fox_76 on Sat Mar 12, 2011 3:16 am
@Mariuzzs:
ALL my patches are released inside this topic. Except the few graphic things released the last days, ALL general patches are combined in my package ver 2.4 (you can download it directly from megaupload.com at the beginning of this topic or here: http://download.nba-live.com/index.php?act=view&id=2536).
To many trees to see the forest?;-)
So all of my courts are included in my package VER 2.4!
C ya
Mel
Last edited by Mel_Fox_76 on Sat Mar 12, 2011 3:37 am, edited 1 time in total.
-
Mel_Fox_76 - Posts: 194
- Joined: Mon Apr 20, 2009 10:19 am
- Location: My patches are open source
Re: 2009-10 by Mel_Fox_76 (VER2.4 released! on Feb. 21st)
![]() by Mel_Fox_76 on Sat Mar 12, 2011 3:35 am
by Mel_Fox_76 on Sat Mar 12, 2011 3:35 am
But more concentration on the next patch:
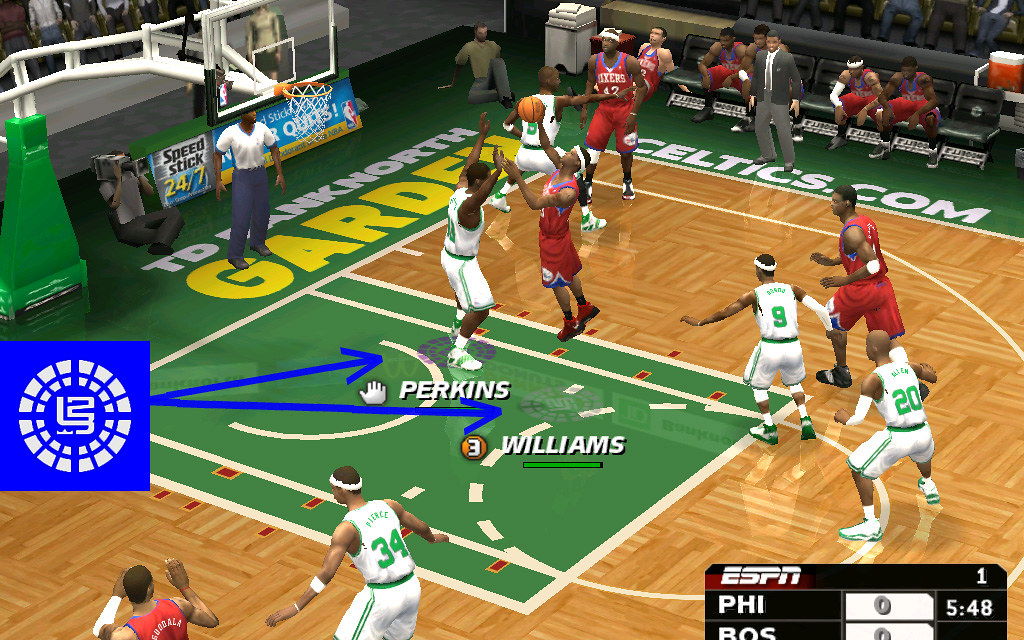
I improved my player indicator patch. As I noted a few days before, I have been “influenced by the impression of tenedordvd's pictures in his topic viewtopic.php?f=32&t=78623” to create a player indicator patch like his. My first version wasn't that great, but this one is a step into the right direction.
Obviously based on his, but still with some LeBron flair.
Enjoy it
C ya
Mel
PS: When I was searching the web for some circle designs, I've found some links to the NBA Live 2008 forum of this one. There, somebody had the idea to delete the player indicator... and many (including our 'good soul' Andrew) were excited by the idea. But myself, I am doubting, especially when playing with more than one human player, I would expect that to be difficult...? Don't know? Andrew, have you played '08 with other human players without player indicators? Is it working in sense of keeping orientation (for example two human players controlling different ballers of ONE team...)
Moreover, this player indicator looks much better than the one before, at least in my eyes. Andrew, could you please upload this one separated from the other one? Maybe some are prefering the first one. Thanks!
You do not have the required permissions to view the files attached to this post.
-
Mel_Fox_76 - Posts: 194
- Joined: Mon Apr 20, 2009 10:19 am
- Location: My patches are open source
Re: 2009-10 by Mel_Fox_76 (VER2.4 released! on Feb. 21st)
![]() by mariuzzs on Sat Mar 12, 2011 5:44 am
by mariuzzs on Sat Mar 12, 2011 5:44 am
Mel_Fox_76 i have you pack 2,4 but not all courts 2011 season  China pack good but name on jerseys is AAAAAA i like in this pack shoot boards is more realistic
-
mariuzzs - Posts: 149
- Joined: Wed Jul 28, 2010 10:20 pm
- Location: Lithuania
Re: 2009-10 by Mel_Fox_76 (VER2.4 released! on Feb. 21st)
![]() by Andrew on Sat Mar 12, 2011 2:19 pm
by Andrew on Sat Mar 12, 2011 2:19 pm
Nicely done. 
Contact: Email | X | Bluesky
Modding Topics: NBA 2K10 | NBA Live 08 | NBA Live 07 | NBA Live 06 | NBA 2K6 | NBA Live 2005 | NBA Live 2004 | NBA Live 96
Story Topics: NBA Live 16 | NBA 2K14 | NBA 2K13 | NBA Live 06 (Part 2) | NBA Live 06 (HOF) | NBA Live 2004 (HOF)
NLSC: Podcast | The Friday Five | Monday Tip-Off | Wayback Wednesday | Facebook | X | YouTube | Instagram | Bluesky
Donations/Support: Patreon | PayPal
-
Andrew - Retro Basketball Gamer
- Posts: 115296
- Joined: Thu Aug 22, 2002 8:51 pm
- Location: Australia
Re: 2009-10 by Mel_Fox_76 (VER2.4 released! on Feb. 21st)
![]() by search and destroy on Mon Mar 14, 2011 1:50 am
by search and destroy on Mon Mar 14, 2011 1:50 am
mariuzzs wrote:Mel_Fox_76 i have you pack 2,4 but not all courts 2011 season
To fix the 'AAA' bug, downloading the official EA patch should help.
And as a help note: try google
- search and destroy
- Posts: 47
- Joined: Tue Oct 05, 2010 5:15 am
Re: 2009-10 by Mel_Fox_76 (VER2.4 released! on Feb. 21st)
![]() by cykim4 on Mon Mar 14, 2011 7:40 am
by cykim4 on Mon Mar 14, 2011 7:40 am
Nice work as usual, Mel_Fox_76!
- cykim4
- Posts: 143
- Joined: Tue Apr 13, 2010 12:53 am
Re: 2009-10 by Mel_Fox_76 (VER2.4 released! on Feb. 21st)
![]() by mariuzzs on Thu Mar 17, 2011 5:35 pm
by mariuzzs on Thu Mar 17, 2011 5:35 pm
this pack is not full many bugs...
-
mariuzzs - Posts: 149
- Joined: Wed Jul 28, 2010 10:20 pm
- Location: Lithuania
Re: 2009-10 by Mel_Fox_76 (VER2.4 released! on Feb. 21st)
![]() by Andrew on Thu Mar 17, 2011 8:28 pm
by Andrew on Thu Mar 17, 2011 8:28 pm
I'm sorry, but that's pretty useless feedback to give a patchmaker. You don't go into any details about the supposed "bugs", so I'm not sure how you expect Mel_Fox_76 to fix the problem or address the situation. If you don't go into detail with feedback and clarify what you're talking about, there's really no point posting at all.
Contact: Email | X | Bluesky
Modding Topics: NBA 2K10 | NBA Live 08 | NBA Live 07 | NBA Live 06 | NBA 2K6 | NBA Live 2005 | NBA Live 2004 | NBA Live 96
Story Topics: NBA Live 16 | NBA 2K14 | NBA 2K13 | NBA Live 06 (Part 2) | NBA Live 06 (HOF) | NBA Live 2004 (HOF)
NLSC: Podcast | The Friday Five | Monday Tip-Off | Wayback Wednesday | Facebook | X | YouTube | Instagram | Bluesky
Donations/Support: Patreon | PayPal
-
Andrew - Retro Basketball Gamer
- Posts: 115296
- Joined: Thu Aug 22, 2002 8:51 pm
- Location: Australia
Re: 2009-10 by Mel_Fox_76 (VER2.4 released! on Feb. 21st)
![]() by Mel_Fox_76 on Fri Mar 18, 2011 1:42 pm
by Mel_Fox_76 on Fri Mar 18, 2011 1:42 pm
Anyway, I have spent a lot of time on a couple patches. So their quality varies. In general, I'm very satisfying my package ver 2.4 which is ONLY based on 2009-2010 as its name indicates. So there won't be courts that have changed from 2009/2010 to 2010/2011 (for example Cleveland or Golden State).
About the "bugs" I would only concede few little details:
- Some players haven't been integrated and won't be --> most of them are unknown role players
- Some players haven't got realistic cyber faces or aren't integrated yet --> I'm working on that (a list of missing or not good enough CF is noted on page 1)
- Golden State's court of 2009-2010 hasn't been done so far --> I'm gonna fix that later
- Some courts have partly different colours than the Originals --> It's a problem I can't dissolve so far. Currently, the area between basket and free throw line has always the same colour as the area around the court. If a real court has different colours for these areas, I need to choose one of them. An example for that is my Oklahoma City court. That's not perfect, but I'm surviving it so far. Maybe I'll find a way to fix that later... but the positive aspect of my court patches (which are based on Rix' patched files!) is that players won't sink into the court as if it was water (I've seen that in other patches). That's why I prefer my patches.
The only other "bugs" I know in my package are:
- Choosing new teams in the playoff mode doesn't work --> I don't know why it isn't working, but it's not that important to me
- Choosing Charlotte Bobcats in Dynasty mode doesn't work --> Bothers me more, but don't know how to fix it, too
- When adding Charlotte in season mode regular season has 86 games --> Not a problem at all to me
All in all I see some little "bugs", but none of those is making me sad. As I have NEVER seen any patch made by mariuzzs, I think we can't have a peaceful battle (like in breakdance or freestyle rap)... but forget about trash talk. Finally, I appeal NOT to forget that all of our patches are FREE!!! We are creating them in our free time without any commercial aims. So I would advise you to change your consumer's view. In my eyes, all patches are presents/gifts, not products with a price. Keep that in mind!
C ya
Mel
Last edited by Mel_Fox_76 on Fri Mar 25, 2011 3:17 pm, edited 2 times in total.
-
Mel_Fox_76 - Posts: 194
- Joined: Mon Apr 20, 2009 10:19 am
- Location: My patches are open source
Re: 2009-10 by Mel_Fox_76 (VER2.4 released! on Feb. 21st)
![]() by mariuzzs on Fri Mar 18, 2011 6:56 pm
by mariuzzs on Fri Mar 18, 2011 6:56 pm
good work Mel_Fox
-
mariuzzs - Posts: 149
- Joined: Wed Jul 28, 2010 10:20 pm
- Location: Lithuania
Re: 2009-10 by Mel_Fox_76 (VER2.4 released! on Feb. 21st)
![]() by Andrew on Sat Mar 19, 2011 12:08 pm
by Andrew on Sat Mar 19, 2011 12:08 pm
There's no need for sarcasm. Again, if you want to provide constructive feedback, you need to actually mention the issues you're referring to.
Contact: Email | X | Bluesky
Modding Topics: NBA 2K10 | NBA Live 08 | NBA Live 07 | NBA Live 06 | NBA 2K6 | NBA Live 2005 | NBA Live 2004 | NBA Live 96
Story Topics: NBA Live 16 | NBA 2K14 | NBA 2K13 | NBA Live 06 (Part 2) | NBA Live 06 (HOF) | NBA Live 2004 (HOF)
NLSC: Podcast | The Friday Five | Monday Tip-Off | Wayback Wednesday | Facebook | X | YouTube | Instagram | Bluesky
Donations/Support: Patreon | PayPal
-
Andrew - Retro Basketball Gamer
- Posts: 115296
- Joined: Thu Aug 22, 2002 8:51 pm
- Location: Australia
Re: 2009-10 by Mel_Fox_76 (VER2.4 released! on Feb. 21st)
![]() by natu718 on Wed Mar 23, 2011 9:29 pm
by natu718 on Wed Mar 23, 2011 9:29 pm
The number of scores and the number of assistance when simulating it are low.
Can the number of scores and the number of assistance be increased?
To externals of the following forums
Can the number of scores and the number of assistance be increased?
To externals of the following forums
- natu718
- Posts: 36
- Joined: Mon Feb 19, 2007 9:47 pm
Re: 2009-10 by Mel_Fox_76 (VER2.4 released! on Feb. 21st)
![]() by Mel_Fox_76 on Wed Mar 23, 2011 11:11 pm
by Mel_Fox_76 on Wed Mar 23, 2011 11:11 pm
Yeah man!
That's a little problem. So far the max. assists per game rate is limited to about 8.7 Assists per game for baller playing around 36 minutes per game. Obviously a problem when thinking about Rajon, Steve, Chris and Deron. Inside the game 99 in passing and 99 in handling are leading to the highest possible rate, but as said, it's not enough. May be patching some .dbf files can be a way to do it. So far I didn't find a specific way to fix that. The same for a realistic balance between field goal attempts and free throw attempts. While players with higher scoring (for example Joe Johnson, JR Smith, Derrick Rose) tend to have too much free throw attempts, super high scorers (D Wade, LBJ, Durant) and Dwight Howard tend to have a lot less than in reality. Basically, the relation between fgpbase (shooting) and inside scoring (scoring next to the basket) influences the number of free throws. The more the relation focuses on inside scoring, the more free throws will be attempted. This why players like DWade, LBJ, Tyreke Evans, Gerald Wallace and some others have a relative low shooting ability and players like Joe Johnson and JR Smith a very high shooting ability and very low inside scoring.
I don't understand your note about the "scores"...? What do you mean? Almost every player produces realistic numbers in scoring. That means points per game, fg% and 3 point attempts are VERY close to reality. I've made the decision to calculate stats. That means I simulated a season and looked at the minutes per game (for example 35 min) of one baller and then looked at the real stats (for example 32 min). Then I've divided the in game minutes (35) to the real minutes (32). The outcoming factor is 1.09375. Multiply this factor with each of the real stats (3s attempts, free throw attempts, off rebs per game, def rebs per game, steals per game, assists per game and blocks per game) and you'll get the most REALISTIC stats! In this sense some stats differ from real stats, because players in the game often play more or less minutes than the same ballers in reality! Another aspect is the number of played games. When I simulate I select 'no injuries' and no trades. So every baller plays the whole 82 games. So this goes into calculation in the same way as well. If a baller played 56 games in 2009-2010, you have to multiply his 3p attempts and free throw attempts with (82/56=) 1.464.
Moreover, on a team basis, it's the opposite. Many teams are scoring too many points per game (almost all are above 100 per game). So the best defense (Boston) allows about 98 pts per game. Team stats are depending on field goal percentage and average skills in shooting (the more fgpbase the more is the team scoring), but as I noted, individually it's conflicting with free throw attempts...
Another difficult decision is, to create differences between the teams. Not every baller produces the same numbers in scoring for every team. The question is, if a baller is relatively higher scoring in teams with high team scoring or not. I've decided to let ballers have a high level in primacy (how many field goal attempts + free throw attempts a player will have) in high scoring teams. In this sense a player of an offensively strong team (for example Monta Ellis) would score a lot more points on an offensively weak team (for example Minnesota).
Some examples in reality are showing that more factors are defining the performance of a baller on a new team, but it's just a game;-)
Finally, we're on very high discussion level. When comparing those little problems to resulting numbers in (not patched) current games like NBA Live 2010 or NBA 2 K11 (I owe NBA 2K9 on PS3), there's no question about the stats any more!
That's all I was able to do
C ya
Mel
Last edited by Mel_Fox_76 on Fri Mar 25, 2011 3:22 pm, edited 2 times in total.
-
Mel_Fox_76 - Posts: 194
- Joined: Mon Apr 20, 2009 10:19 am
- Location: My patches are open source
Re: 2009-10 by Mel_Fox_76 (VER2.4 released! on Feb. 21st)
![]() by search and destroy on Thu Mar 24, 2011 12:42 am
by search and destroy on Thu Mar 24, 2011 12:42 am
I could never have the patience as a patcher to correct schools, tendencies, stats etc. That's one difference between you and me. Creating hundreds of people and straightening up the rosters/lineups was enough for me. Hope to see more from you bro.
And as for mariuzzs, do REMEMBER that patchers update the game for FREE. Completely free. Days worth of hours for free. As Mel_Fox said, it's almost like a gift to a gaming community. Key thing here, please be polite when speaking on a patch/to a patcher.
And as for mariuzzs, do REMEMBER that patchers update the game for FREE. Completely free. Days worth of hours for free. As Mel_Fox said, it's almost like a gift to a gaming community. Key thing here, please be polite when speaking on a patch/to a patcher.
- search and destroy
- Posts: 47
- Joined: Tue Oct 05, 2010 5:15 am
Re: 2009-10 by Mel_Fox_76 (VER2.4 released! on Feb. 21st)
![]() by Mel_Fox_76 on Fri Mar 25, 2011 2:29 pm
by Mel_Fox_76 on Fri Mar 25, 2011 2:29 pm
...here was the old version of dornas patch...
Last edited by Mel_Fox_76 on Fri Oct 28, 2011 2:06 am, edited 1 time in total.
-
Mel_Fox_76 - Posts: 194
- Joined: Mon Apr 20, 2009 10:19 am
- Location: My patches are open source
Re: 2009-10 by Mel_Fox_76 (VER2.4 released! on Feb. 21st)
![]() by Andrew on Sat Mar 26, 2011 12:02 am
by Andrew on Sat Mar 26, 2011 12:02 am
Good stuff. For future reference, those advertising boards are referred to as dornas.
Contact: Email | X | Bluesky
Modding Topics: NBA 2K10 | NBA Live 08 | NBA Live 07 | NBA Live 06 | NBA 2K6 | NBA Live 2005 | NBA Live 2004 | NBA Live 96
Story Topics: NBA Live 16 | NBA 2K14 | NBA 2K13 | NBA Live 06 (Part 2) | NBA Live 06 (HOF) | NBA Live 2004 (HOF)
NLSC: Podcast | The Friday Five | Monday Tip-Off | Wayback Wednesday | Facebook | X | YouTube | Instagram | Bluesky
Donations/Support: Patreon | PayPal
-
Andrew - Retro Basketball Gamer
- Posts: 115296
- Joined: Thu Aug 22, 2002 8:51 pm
- Location: Australia
Re: 2009-10 by Mel_Fox_76 (VER2.4 released! on Feb. 21st)
![]() by henrylin722 on Thu Apr 07, 2011 9:08 pm
by henrylin722 on Thu Apr 07, 2011 9:08 pm
Can you please help me to create a team please?
I downloaded ur patch. Want to create a team like 00's all star, can you create a team for me please?
I can give you the player looks ratings and those.
Thank you.
I downloaded ur patch. Want to create a team like 00's all star, can you create a team for me please?
I can give you the player looks ratings and those.
Thank you.
- henrylin722
- Posts: 5
- Joined: Thu Mar 17, 2011 11:15 pm
Re: 2009-10 by Mel_Fox_76 (VER2.4 released! on Feb. 21st)
![]() by Andrew on Fri Apr 08, 2011 12:57 am
by Andrew on Fri Apr 08, 2011 12:57 am
There are tutorials on creating custom teams in our Wiki.
Contact: Email | X | Bluesky
Modding Topics: NBA 2K10 | NBA Live 08 | NBA Live 07 | NBA Live 06 | NBA 2K6 | NBA Live 2005 | NBA Live 2004 | NBA Live 96
Story Topics: NBA Live 16 | NBA 2K14 | NBA 2K13 | NBA Live 06 (Part 2) | NBA Live 06 (HOF) | NBA Live 2004 (HOF)
NLSC: Podcast | The Friday Five | Monday Tip-Off | Wayback Wednesday | Facebook | X | YouTube | Instagram | Bluesky
Donations/Support: Patreon | PayPal
-
Andrew - Retro Basketball Gamer
- Posts: 115296
- Joined: Thu Aug 22, 2002 8:51 pm
- Location: Australia
Re: 2009-10 by Mel_Fox_76 (VER2.4 released! on Feb. 21st)
![]() by henrylin722 on Sat Apr 09, 2011 2:27 am
by henrylin722 on Sat Apr 09, 2011 2:27 am
I tried but I cant.
IDK how to use the team logo & team jersey.. courts etc...
A lot of problems...
IDK how to use the team logo & team jersey.. courts etc...
A lot of problems...
- henrylin722
- Posts: 5
- Joined: Thu Mar 17, 2011 11:15 pm
Re: 2009-10 by Mel_Fox_76 (VER2.4 released! on Feb. 21st)
![]() by Mel_Fox_76 on Sat Apr 09, 2011 2:58 pm
by Mel_Fox_76 on Sat Apr 09, 2011 2:58 pm
Henry!
Thanks for the compliment that you like my patches. Probably you haven't tried to create your own patches. I even have finished a long mail to another user that helped me with my patches. He didn't know how to create courts. So I helped in the way to explain how to do it. But creating a court is just a piece of creating a whole team. A team includes almost everything that can be patched. A lot of logos, at least 1 or 2 jerseys, a court, player values including new birth IDs, player portraits and cyber faces. To create a whole team from zero, I think it will be about 70 hours without the cyber faces. Depending on the number of players and demanded level of quality at least 4 to 6 hrs per CF. With 10 ballers it would be at least 110 hours for everything (if I would try to do it the way I did before), JUST FOR ONE TEAM! Most difficult are jerseys, courts and cyber faces, especially with white coloured players. At least the jersey would be a bit easier since the user jonhpipepipe has released a big pack of jerseys that includes some not-NBA teams. May be yours is there...
Finally I can't help you. Basically you need to learn how to create patches for all these little things. It's gonna be a lot of work. But when I started to patch NBA Live 2004 I didn't know how much time I would be spending with the work of patching. The result is here. I think my patch has parts with higher and lower qualities, but it's been a long way to improve.
To start your way into the world of being an active patcher you should download this tutorial:
http://download.nba-live.com/index.php?act=view&id=2502
Afterwards the little steps to patch more and more things will be a question of experience and creativity (especially with a bad photo editing software;-))
Hope you gonna make it!
C ya
Mel
Last edited by Mel_Fox_76 on Sat Apr 09, 2011 3:31 pm, edited 2 times in total.
-
Mel_Fox_76 - Posts: 194
- Joined: Mon Apr 20, 2009 10:19 am
- Location: My patches are open source
Re: 2009-10 by Mel_Fox_76 (VER2.4 released! on Feb. 21st)
![]() by Mel_Fox_76 on Sat Apr 09, 2011 3:20 pm
by Mel_Fox_76 on Sat Apr 09, 2011 3:20 pm
Plus a little appeal @all:
Since my topic has so many replies, it has become more and more difficult for users to find downloads inside my topic.
Generally, I would please everybody to create your own topic if questions are about the patching itself. Apart from the missed players (+ few improvements of existing CFs) and few court things, I won't create new patches that have nothing to do with the NBA in 2009-2010. My aim is to finish my 2009-2010 package and done. If you have some specific questions about patching and nobody would be answering in your created topic, you can send a private message to myself and I'll do what I can.
@Cykim4: My upcoming patches will include some players that aren't patched so far. Joe Johnson is on the list as well, but I have no time to do it now. Please be patient.
C ya
Mel
-
Mel_Fox_76 - Posts: 194
- Joined: Mon Apr 20, 2009 10:19 am
- Location: My patches are open source
Re: 2009-10 by Mel_Fox_76 (VER2.4 released! on Feb. 21st)
![]() by cykim4 on Tue Apr 12, 2011 4:57 am
by cykim4 on Tue Apr 12, 2011 4:57 am
Thanks, Mel_Fox_76! I know you're busy and that's why I appreciate your efforts even more
- cykim4
- Posts: 143
- Joined: Tue Apr 13, 2010 12:53 am
Re: 2009-10 by Mel_Fox_76 (VER2.4 released! on Feb. 21st)
![]() by jonhpipepipe on Tue Apr 12, 2011 10:38 pm
by jonhpipepipe on Tue Apr 12, 2011 10:38 pm
Mr. Henry,
Try my topic here: viewtopic.php?f=32&t=75716
As Mr. Fox said before, maybe it would help you, there is a big collection with jerseys of older patchers, i just give a little hand myself to improve the collection...
We are here to help, all right bro!!
See ya.
Try my topic here: viewtopic.php?f=32&t=75716
As Mr. Fox said before, maybe it would help you, there is a big collection with jerseys of older patchers, i just give a little hand myself to improve the collection...
We are here to help, all right bro!!
See ya.
Believe... God is above us all!
-

jonhpipepipe - Posts: 142
- Joined: Thu Sep 30, 2010 10:07 am
- Location: Wonderful City - Brazil
Who is online
Users browsing this forum: No registered users and 1 guest